Monday, September 26, 2011

My Sunflower - Day 19


They're growing!! I forgot to take measurements of the stems and leaves but it appears as though the tallest plant would be in Vegetative Stage V2.

Sunday, September 25, 2011

Lab 3: Campus Nature Walk

Trees
                                              Hickory Tree - Carya tomentosa


                                                Pine Tree - Pinus palustris

                                         Sycamore Tree - Platanus occidentalis


American Larch - Larch laricina


Magnolia Tree: Magnolia grandiflora

Shrubs
Carissa Holly - Ilex spp.


Juniper - Juniperus communis


Boston Ivy - Parthenocissus tricuspidata


Crape Myrtle - Lagerstroemia indica


Privet Hedges - Ligustrum amurense

Plants
Mexican Petunia - Ruellia brittoniana


Monkey grass - Ophiopogon japonicus


Angel's Trumpet - Brugmansia aurea


Lizard's Tail - Saururus cernuus


Sago Palm - Cycas revoluta


Lab 2: Ocmulgee River Adventure


Above is a map of the section of the Ocmulgee River that we visited during our lab session. During this session we did three things: (1) flow rate testing, (2) clam collection, and (3) elevation measurement. For the flow rate testing, we used a tennis ball. One person stood in the water and another student stood 10 yards away, parallel to water flow. The student further upstream dropped the tennis ball into the water and we timed how long it took the ball to reach the student downstream. This information is then used to calculate the flow rate of the water.
Another group took samples of clams. They placed a large meshed sifter under water and when it was brought back up, the students totaled the number clams that were in the sifter, taking note of how many were dead and alive.
For elevation measurement, there were two poles connected by a 10 yard string. The poles were marked incrementally for height measurement. The poles were placed so that the string connecting them would be taunt. If the string was not completely horizontal when the poles were placed onto the terrain, the string could be adjusted up or down to make it so. This adjustment of the height of the string is what determined the depth in relation to the original spot on the river bank. This movement of the poles was continued for the width of the river transect.

Tuesday, September 20, 2011

My Sunflower - Day 13


So far so good. I took some measurements today. The tallest stem is 13.3cm long (taken from the top of the soil). The shortest leaf is 1.4cm and the longest leaf is 3.1cm.

Saturday, September 17, 2011

My Sunflower - Day 10


There seems to be steady progress in the growth of my sunflowers. (Yes, plural, because apparently I planted 3 seeds. lol) Each of them has 2 larger leaves and 2 smaller leaves. I decided to measure them today, finding that the leaf sizes ranged from 4mm (the smaller set) to 2.5cm (the larger set). Since the leaves are shorter than 4cm, the sunflowers are still considered to be in the Vegetative Emergence stage.

Tuesday, September 13, 2011

My Sunflower - Day 6


I checked on my sunflower today and to my surprise, I saw green!! I didn't expect to see life this quickly. Based on some research I've done on sunflower growth, my sunflower is currently in the Vegetative Emergence stage. This simply means that the seedling has emerged and the first leaf beyond the cotyledon is less than 4 cm long. Stay tuned!

Thursday, September 8, 2011

My Sunflower - Day 1


Today is the start of my quest to growing a magnificent sunflower. I was given the inner plastic cup, soil, and a couple of sunflower seeds today in class to grow the sunflower all semester. With the inner cup, I have placed a series of holes at the bottom to allow excess water to drain. I decided that I didn't want the cup to come in contact with the soil on the ground so I placed the cup inside of a larger plastic cup. (It previously housed a McDonalds strawberry-banana smoothie. Yay for recycling!) When I first placed the smaller cup inside the larger one it just rested at the bottom. This, however, defeats the purpose of trying to accommodate for water drainage because the water would have no where to go. As a result, I came up with the ingenious idea of taking 4 drinking straws and using them as splints to prevent the inner cup from resting on the bottom of the larger cup. The straws are secured with thumbtacks and scotch tape (yes, I am very resourceful). The straws hold the inner cup approximately .75in from the bottom surface of the outer cup. I then placed this contraption about 2 inches into the ground against the edge of the porch and used this random 6 inch nail I found in the yard as a stability reinforcement in case of gusty winds. Lastly, I added water (hopefully not too much). I guess in time we will see if I have a green thumb!

Monday, September 5, 2011

My Isarithmic Map

Here is my Isarithmic Map depicting the annual precipitation in Georgia. Measurements are in inches.

My Happy Place - Lake Tobesofkee


My happy place is a small island of land that sits in Lake Tobesofkee in my neighborhood. I enjoy going here to fish and just to relax on a beautiful day. The only downside is that there is a chance you might see a water moccasin or two.

Lab 1: Types of Maps

Isarithmic Maps

Isarithmic maps, also known as contour maps, depict smooth continuous phenomena such as rainfall, temperature, or population.


Above is an example of an isarithmic map showing the temperatures across the contiguous United States on August 9, 2000.

Choropleth Maps

Choropleth Maps show statistical data aggregated over predefined regions, such as a state or country, using different colors or shadings of the same color.


Above is an example of a choropleth map depicting the estimated median household income across the contiguous United States in the year 2008. The darker shades represent the higher incomes.

Dot Density Map
Dot Density maps use the dot symbol (.) to show the presence of a particular feature or phenomena. They are useful for understanding global distributions of the mapped phenomena and comparing the relative densities of the different regions of the map.


Above is an example of a Dot Density map depicting the United States population distribution in the year 2000. For this particular map, one dot represents 7500 people.

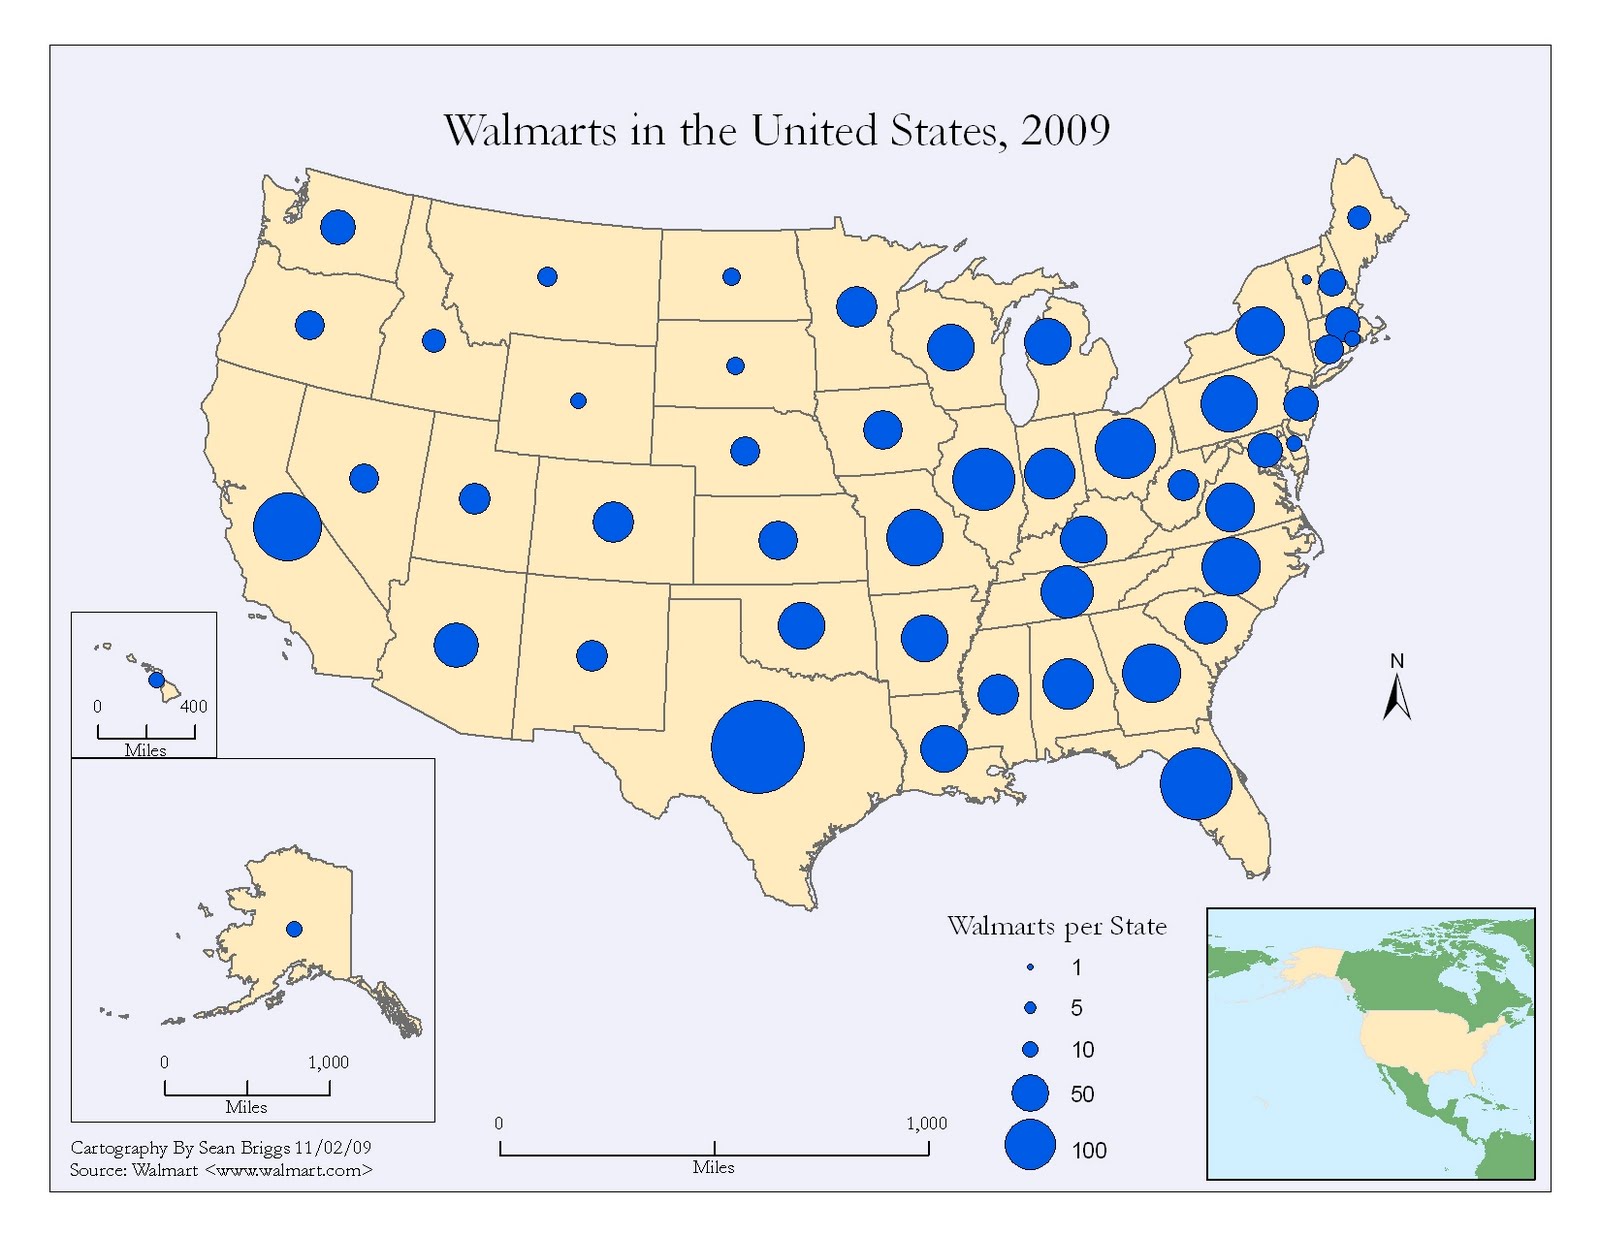
Proportional Symbol Map

A Proportional Symbol map uses symbols of different sizes to represent data associated with the different areas on the map.


Above is an example of a Dot Density map depicting the number of Walmart stores per state in the United States in 2009. The larger the dot the larger the quantity of Walmart stores in that particular state.

Saturday, September 3, 2011

The Saintpaulia


Saintpaulia, commonly known as the African Violet, is a genus of the family Gesneriaceae. Native to Tanzania, this flower was named after Tanga province district commissioner Baron Walter von Saint Paul-Illaire, who discovered the plant in Tanganyika (now Tanzania) in Africa in 1892.


There are 6 species of the Saintpaulia, ranging in size from 6-15cm tall and 6-30cm wide. The leaves of the plant are a rounded oval shape, of a fleshly texture, and finely haired. The flower consists of 5-lobed velvety petals. They grow in clusters of 3 to 10 and are usually of the color violet, purple, pale blue, or white.


Fascinatingly, the African Violet can be easily reproduced. So, if you are interested in propagating this beautiful plant, check out the clip below.


The African Violet is also the official flower of my sorority, that is, Delta Sigma Theta Sorority, Inc.